no more extensions and debugging tools for the developers.
-
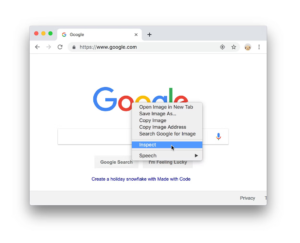
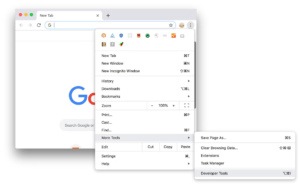
- To Open the Chrome devtools:
Basically, we can do that in many ways:
1- The Inspect option Or press Command+Option+C (Mac) or Control+Shift+I (Windows, Linux, ChromeOS)2- Open by right-clicking and choosing Inspect

3-
Click Customize and Control Google Chrome (The vertical three dots on the most top-right of the browser)

Let’s get quick info about the devtools tabs:
- Elements: This tab shows the Html code of the opened web page
- Console: It logs the errors and the exceptions for the user, and you can some JavaScript commands on it.
- Sources: Contains the tree files of the technologies and utils that the web page may have.
- Network: In this tab, you can see the API requests and some utils that are shown when the page is reloaded or the causing an event like (Clicking a button)
- Performance: This tab is used for analyzing your page performance
- Memory: For recording the memory allocations using the sampling methods
- Application: It’s consists of main four parts : (Application, Storage, Cash, Frame, and Background Services)
- Security: In this tab, you can check if the web page is secured or not and you can check the connection and the resources secureNow after getting quick info about the devtools we can move to learn some tricks and magic things you can do with the devtools
1-Downloading Protected Images From Any Website:
Open the devtools and hover with your mouth courser on the protected image, in the Elements tab it will highlight the image tag which will show like this <image href=URL> hover on the URL in the Image tag and right click and save the image
2-Downloading Video From Any Site:
Visit the page in chrome and open ‘Developer Tool’ by pressing F12 or right-click -> inspect element Go to -> Networks Tab and click the ‘Media’ tag in the filter row Click the ‘Play’ button on the player. you will see a link in the networks tag Just open that link in the new tab. video will open in a normal browser’s player. Now right-click the on the video and ‘Save’ to your local machine
3-Change The Web Page Design:
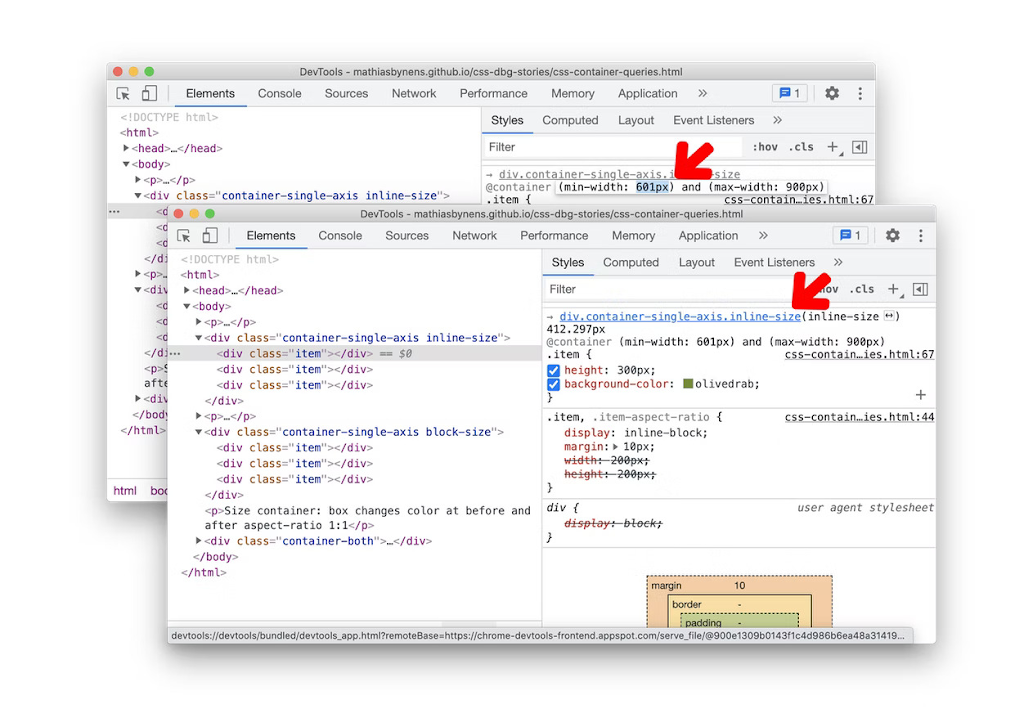
By inspecting the web page and on the Elements tab on the devtools you will see the Html tags for the web page, in the right side you will see a small vertical panel consisting of many tabs : (Styles, Computed, Layout, and much more), in our case we need the Style tab when you open it you will see the CSS code that you can change for change the selected element design.4-Show The Text Written In Password Mode:
Open the login form where you have your autocompleted password or any password field write anything there and inspect the page to see the devtools then select the password field and on the Elements tab will highlight the Input tag: <Input type:” Password”> now you just need to change the Input type from password → and you will able to the password.5-See The Web Page In Different Screen Sizes:
Besides the Element tags on the Devtools, you will see an icon called “toggle device toolbar” click on it, then you will be able to change the screen size to any size you want : (mobile in different sizes, tabs, notebooks,…).
6-See What Technology a Site Is Using:
With Developer Tools open in the Elements tab, find the <head> tag in the HTML and click on it to expand the section, You’ll see all the tracking JavaScript for the site. - Finally, I would like to say that the Chrome Developer Tools is a very important and powerful thing that every user should know how to use it and every developer have to master it.
- Thank you for your attention and if you need to know more to master the Devtools in general.
- Don’t forget to follow me on Twitter where I tweet about Game Development and programming in general → Twitter
And my Github account → Github
- To Open the Chrome devtools:


you are truly a just right webmaster. The site loading speed is incredible. It kind of feels that you’re doing any distinctive trick. In addition, The contents are masterwork. you have done a great activity in this matter!